Connectivity is one of the key levers to transform SEQ to a world class region in the next 25 years. This has been recognised in ShapingSEQ, the regional strategy for the development of SEQ. Connectivity within the SEQ region has also been fully endorsed by CoMSEQ. As a result, a significant part of the study focuses on the needs of SEQ for regional connectivity over the 25 year period 2016-2041.
By 2031, the combination of population and employment growth is anticipated to increase transport demand across SEQ by 31% (subject to final modelling outputs). Population alone will increase by an additional 1,030,000 residents (Source: ShapingSEQ). From 2031 to 2041, transport demand will continue to grow by another 18% and population by 820,000 residents. This growth is expected to impose significant pressure on the transport network across SEQ.
Using TMR’s strategic transport model for SEQ it has been found that the current transport strategies and infrastructure will not be able to cope with the mobility demand along key road and public transport corridors that will be operating beyond capacity. Furthermore, public transport mode share growth is anticipated to level off beyond 2032. These outcomes are expected to have negative impacts on quality of life and on SEQ’s Vision to “grow sustainably, compete globally and offer high-quality living”. It is clear that additional transport infrastructure and systems are required to support the rate of growth in SEQ. The current Strategic Transport Road Map has been developed as a blue print to help address these future constraints and challenges.
The Strategic Role of Transport Modes in SEQ
Existing Public Transport Modes
Public transport infrastructure and services vary across SEQ. The urban areas generally have a higher level of public transport infrastructure and services, whereas rural areas have a lower standard of service provision. These significant variations result in differences in public transport mode share and, as an outcome, a stronger use of private vehicles in rural areas is apparent when compared to urban areas.
SEQ is currently serviced by the following four modes of public transport operating on scheduled timetables:
- bus, including on-road buses that operate in mixed traffic (share the road with private and commercial vehicles) and mode / grade separated (i.e. busways and dedicated high occupancy vehicle infrastructure)
- heavy rail (urban train network)
- ferries
- light rail
The definitions below for bus public transport services and infrastructure are as per TransLink’s Public Transport Infrastructure Manual (PTIM)(2015).
Bus Feeder
Local or neighbourhood bus services which operate within lower urban density neighbourhood communities and provide transport connections for passengers wanting to interchange to more frequent line-haul services along designated high-frequency services routes or corridors.
Bus Rapid Transit (BRT)
A form of mass transit which utilises buses operating at a higher capacity and frequency than conventional bus networks. BRT typically features a unique identity with segregated right-of-way measures such as dedicated road corridors (referred to as busways) or High Occupancy Vehicle (HOV) lanes. BRT infrastructure such as stations and busway corridors can be at surface grade, elevated or below ground level. BRT is often characterised as offering the quality of metro rail systems with the flexibility of buses.
Busway
A route especially designed and constructed for, and dedicated to, the priority movement of buses for public transport purposes. Busways can be either at-grade or grade-separated (i.e. elevated over the surrounding development).
Rapid Transit
A form of public transport which involves very high passenger demand resulting in high-quality infrastructure with very frequent services. A distinctive feature of rapid transit is the travel priority given through grade-separated treatments (such as busways or rail corridors).
The Private Vehicle versus Public and Active Transport in SEQ
Personalised modes of transport, other than the private vehicle, provide passenger transport services in SEQ (e.g. taxis, uber, etc.). However, for the purpose of this Study and given its regional context, the focus is on mass public transport services (mass-transit). Notwithstanding, it is noted that within SEQ, like elsewhere in both Queensland and Australia, the private motor vehicle does provide the primary means of mobility. Indeed, since the 1980’s there has been a decline in the proportion of people travelling to work by public transport, walking and cycling as car usage has increased (see Figure 2?1). Certainly, the desire expressed in 2011, as part of the previous SEQ Transport Plan (to 2031) to achieve higher public transport and active transport mode shares, and reduce reliance on the private vehicle, does not appear to have been realised. Despite a large amount of investment into infrastructure, the public transport mode share appears to have been at best “static” over time at the 2006 levels of 7% (see Figure 2?1). However, based on the set targets, the mode share should be at about 10%-11% in 2017. The SEQ Regional Plan 2017 suggests that this “static” public transport mode share result is more than likely attributable to “mostly low density suburban growth across the region, fare increases, subdued levels of economic activity, slowing population growth, declining city centre employment and lower costs of vehicle ownership”.
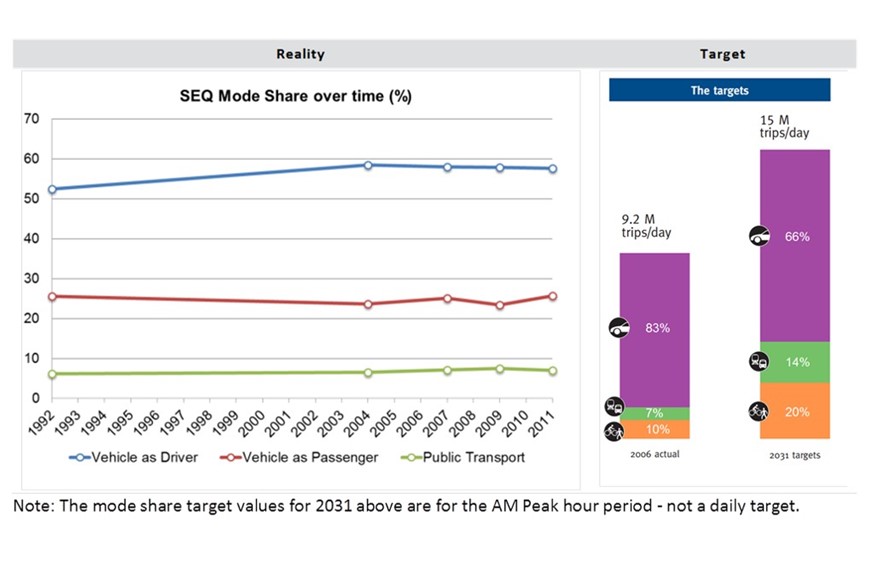
Figure 2 1: SEQ Mode Share over Time (Source: SEQ Regional Plan, Background Paper 3 – Connect) and SEQ Mode Share Targets (circa 2011) (Source: Connecting SEQ 2031).
To reverse the trend of poor public transport mode share (and also to enhance active transport), it is accepted within the Regional and Local Plans that greater investment will be required in public transport infrastructure and services, as well as in active transport connections. This investment will also need to be supported by land use changes towards higher density and mixed-use centres. Appropriate policy settings and the introduction of suitable technological improvements (including transformative technologies) will also be important.
Mobility Demand Priorities
SEQ is Australia’s third-largest capital city region by population (ShapingSEQ, 2016). In this study we consider the entire SEQ region: Sunshine Coast Regional Council, Moreton Bay Regional Council, Somerset Regional Council, Brisbane City Council, Redland City Council, Logan City Council, City of Gold Coast, Ipswich City Council, Lockyer Valley Regional Council, Scenic Rim Regional Council and the Toowoomba urban extent within the Toowoomba Regional Council area (see Figure 2?2 below).
Figure 2 2: Transport study geographic scope – SEQ Area of Interest (Source: Queensland government data).
Significant regional growth is forecasted within the next 25-year period. The estimates presented in Figure 2?3 are aligned with the strategic transport model for SEQ developed by the Queensland Department of TMR. This model has incorporated valuable information regarding population growth, employment growth, as well as significant developments in land use planning.
Specifically, in the area of interest, population is expected to grow as follows (refer also Figure 2?3):
- the population of SEQ is about 3,350,000 (2016)
- by 2031 estimates indicate a 31% population increase, corresponding to additional 1,030,000 SEQ residents
- by 2041 estimates indicate a 55% increase, corresponding to additional 1,850,000 SEQ residents with respect to 2016 levels.

Figure 2 3: Population Projections to 2041 (Source: TMR, 2018)
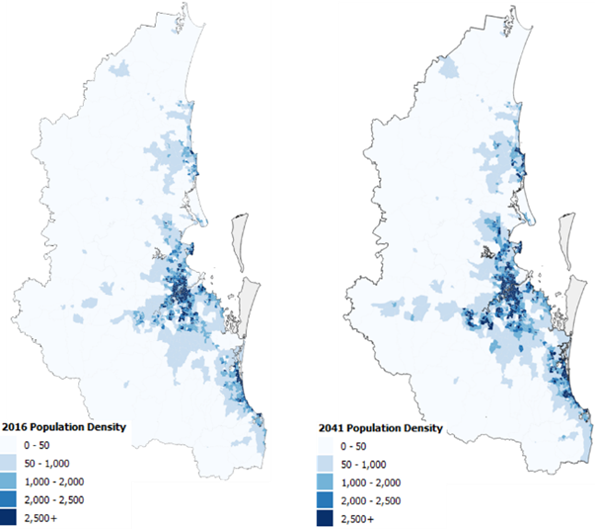
Figure 2 4: Change in Population Density (population per square km) from 2016 to 2041 (Source: TMR, 2018)
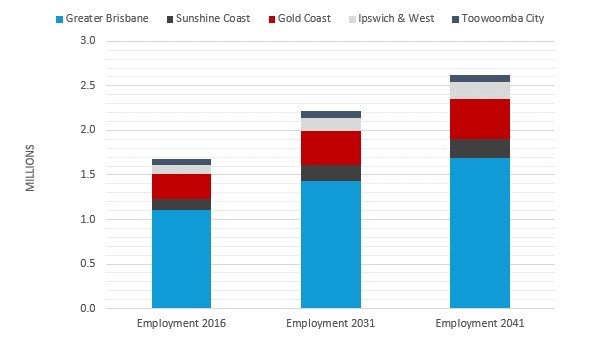
Figure 2 5: Employment Projections to 2041 (Source: TMR, 2018)
In terms of geographical distribution of this significant population expansion, by 2041 a more compact urban growth form is evident in the population density graphs of Figure 2?4. While some of the specific growth areas shown may not be supported by the impacted LGA, the figure showing 2041 population density indicates more intensified development within the Brisbane urban footprint, as well as strong growth along each of the three major regional corridors within SEQ: the north coast, south coast and western transport corridors. These changes are expected to increase the pressure on the Greater Brisbane transport network as well as along each of the above three key corridors.
In line with population growth, employment projections show a proportionate increase in the SEQ area of interest (see also Figure 2?5 and Figure 2?6):
- base year (2016) employment amounts to 1,680,000 jobs.
- by 2031, a 32% increase is estimated, or 538,000 additional jobs
- by 2041, there will be a 57% increase in the job market in comparison to 2016 levels, or an addition of 950,000 jobs.
ShapingSEQ anticipates a further consolidation of the existing and planned employment centres within the inner five kilometre radius of the Brisbane CBD, as well as increased intensification and clustering in Regional (Principal and Major) Activity Centres in SEQ, e.g. Chermside, Maroochydore, Caboolture, Caloundra, Springfield, Meadowbrook and Surfers Paradise. These employment location and density changes (see Figure 2?6) will result in more concentrated transport activity around the CBD and inner core of each city, and at the Regional Activity Centres. As a result, intensified transport demand is expected, which, in turn, will improve the feasibility of delivering high quality public transport solutions at these key centres.

Figure 2?6: Change in Employment Density from 2016 to 2041 (Source: TMR, 2018)