This Strategic Transport Road Map for SEQ (this report) undertaken by the Council of Mayors (SEQ) aspires to plan for world class connectivity that will promote livability and SEQ remains resilient over the next 25 years.
The shared Vision for SEQ is to “grow sustainably, compete globally and offer high-quality living”. By 2031 the combination of population and employment growth is anticipated to increase transport demand across the region by 30%. The population growth of over 1 million by 2031 will continue adding another 820,000 residents by 2041 with an associated transport demand increase of 18%. This continued growth is expected to impose significant pressure on the transport network across SEQ and threaten the liveability vision.
Using TMR’s strategic transport model for SEQ, the current transport strategies, services and infrastructure will not be able to cope with the future transport demand. Without suitable interventions, both road transport and public transport will operate beyond capacity along key regional corridors. Furthermore, without further investment, beyond the current planned investment strategies, public transport mode share growth is anticipated to plateau after 2032. These outcomes are expected to have negative impacts on SEQ’s ability to grow sustainably, compete globally and achieve a high-quality living Vision.

Figure 1: Local and Regional Connectivity Vision for SEQ
Transformative technologies, and associated policy changes, will dramatically change the way people move into the future. These changes will likely increase road carrying capacity possibly by two fold to five fold or greater on motorway corridors, 30% or greater at intersections and potentially 2-3 times on surface streets (urban roads) and will also support the efficiency of access (as “feeders”) to mass transit systems.
To leverage the benefits of transformative technologies in realising the vision for SEQ to become a world-class region, the missing links of SEQ’s strategic transport system (road and public transport) will need to be more strongly connected. A mature motorway and public transport network will not only benefit users in the short-term but also provide a much more resilient region in the longer-term as SEQ will maximise the benefits of increased transport capacity, economic uplift, liveability and potential safety that will result from growth in transformative technologies.
The Road Map has been developed as a blue-print to address these future constraints and challenges. Government and Council strategic plans, transport strategies and infrastructure plans were reviewed to identify common objectives and strategies with these then being synthesised into a shared strategic vision for transport across SEQ.
The Road Map for SEQ includes a Transport Vision (see Figure 1) that consists of two parts:
- a “45 minute “Smart Regional Connectivity” Vision, and
- a “½ hour Smart City” Vision.
The “Smart Regional Connectivity” Vision aspires to achieve travel time between Brisbane-Gold Coast, Brisbane-Sunshine Coast, Brisbane-Ipswich and to the eastern edge of Toowoomba from Brisbane that is less than 45 minutes.
For this “Regional Connectivity” Vision to be realised a high quality mass transit solution is recommended. Faster Rail (with speeds of up to 250km/h) provides a possible solution.The “½ hour Smart City” Vision aims to allow people to live, work and play within a half-an-hour travel time.
The “Smart” part is not only related to technology but also to the city’s form and infrastructure that should be “smart” in key aspects and functions, e.g. in terms of land use and transport integration, and in achieving positive sustainable outcomes (economic, social and environmental).
Four key findings in the Road Map are:road network gaps are placing pressure on the ability to move around SEQ and should be eliminated
- Faster Rail may form a strong regional backbone of public transport in SEQ
- enhancing active and public transport connectivity is key to improving liveability
- the potential benefits of connected autonomous vehicles and technology transformation should be leveraged to maximise the use of infrastructure investments into the future.
To achieve the Vision and address the findings, a Transport Strategy has been developed for the 2031 and 2041 horizons. The Transport Strategy comprises of two scenarios – the “Base” and “Advanced” Scenarios.The Transport Strategy has sought to strike the best balance between the three investment types – roads, public transport and active transport.
The Strategy recommends the “Advanced Scenario” consisting of closing the missing ‘gaps’ of the strategic transport network to maximise efficient accessibility and also investments that support a modal shift away from the current very strong reliance on the private vehicle and more towards sustainable passenger transport services for the longer term.
In particular, for Brisbane to achieve the “½ hour Smart City” and to close major road network gaps (see Figure 2) some key transport initiatives are required. These will also deliver very strong legacy outcomes for Greater Brisbane.

Figure 2: Strategic road network gaps in Brisbane
The key projects that contribute to the Transport Strategy are:
- the North-West Transport Corridor
- Centenary Motorway Bypass
- North-South Link
- East-West Link
- Brisbane Metro
- Cross River Rail
- Faster Rail
- Various Green Bridge and Pedestrian / Cycle Cross-River Links.
Based on the estimated cost of each project, the proposed level of investment required for the “Base” and “Advanced” Scenarios is shown below in Table 1.
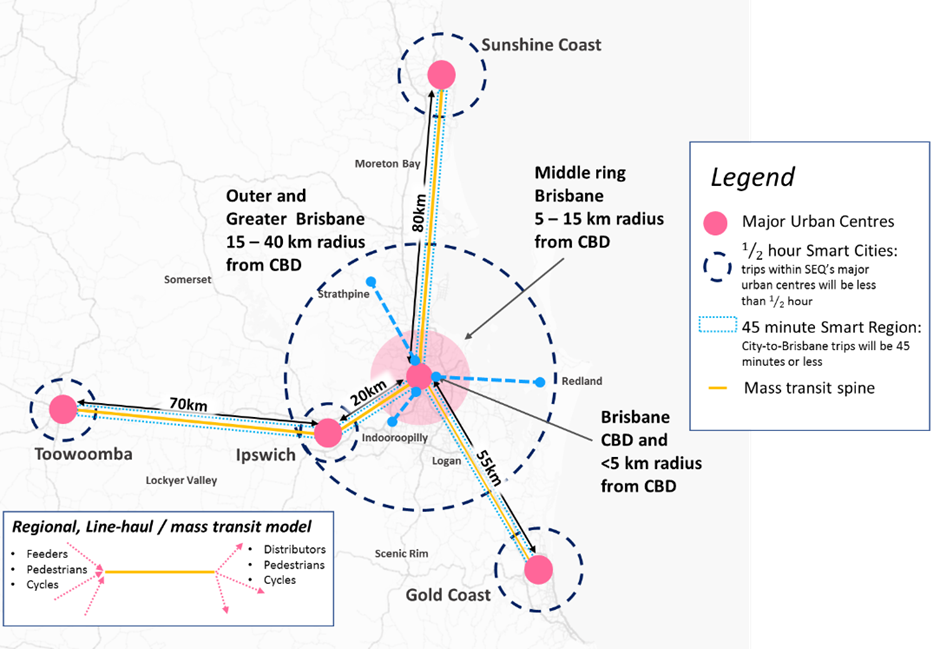
Table 1: Table summarising 2019 to 2031 and 2032 to 2041 Investment Requirements (in billion)
The total planned investment of $63.7bn to 2041 ($2.77bn per year) is achievable when compared to the historic trend of $2-$3bn per year for transport infrastructure in SEQ.
The investment strategy profiles ($43.9bn to 2041) for a) the “base scenario” (which supports the ½ hour city vision), and b) the recommended “advanced” scenario (which achieves the desired regional connectivity and strengthens the ½ hour city vision by investing additional $19.8bn to 2041) are illustrated in Figure 3.
It is envisaged that the Plan will generate potential private sector interest with the investment potential estimated up to $24bn, thereby reducing the potential investment required directly by Government.
Figure 3: Investment profile
The benefits to 2041 by delivering the plan include strengthened local and regional connectivity, a resilient transport network, economic growth (business output $127bn, GDP $57bn) and jobs (446,000).
This presents a compelling case for the three levels of Government to commit to the Plan.To implement the Strategic Transport Road Map for SEQ there remains now a need for a tri-partite commitment to the Plan and over time an ongoing commitment to complete business cases for projects and also then construct and implement the services between now and 2041
Acknowledgements
Lagardère Sports / EKS acknowledge the support and inputs to the development of the Regional Transport Strategic Road Map for SEQ by:
- Queensland State Government – Department of Transport and Main Roads
The member councils of Council of Mayors (SEQ):
- Brisbane City Council
- Ipswich City Council
- Logan City Council
- Lockyer Valley Regional Council
- Moreton Bay Regional Council
- Redland City Council
- Scenic Rim Regional Council
- Somerset Regional Council
- Sunshine Coast Regional Council
- Toowoomba Regional Council.
This study was funded through contributions from the member Councils of the Council of Mayors (SEQ) and the Australian Government Department of Infrastructure, Regional Development and Cities.
Disclaimer
This Report makes use of data and/or model outputs (Data) from the South East Queensland Strategic Transport Model Multi-Model (SEQSTM-MM) provided by the State of Queensland (represented by the Department of Transport and Main Roads) (DTMR).In consideration of the State permitting use of Data, the Council of Mayors (SEQ) Pty Ltd (CoMSEQ) and Lagardère Sports / EKS acknowledges and agrees that the State gives no assurance or warranty nor makes any representation in relation to the Data (including accuracy, reliability, completeness, currency or suitability) and accepts no liability (including without limitation, liability in negligence) for any loss, damage or costs (including consequential damage) relating to any use of the Data.Additionally, CoMSEQ acknowledges that the Data as it relates to impacts on regions and specific projects is preliminary and will be subject to further detailed study.